


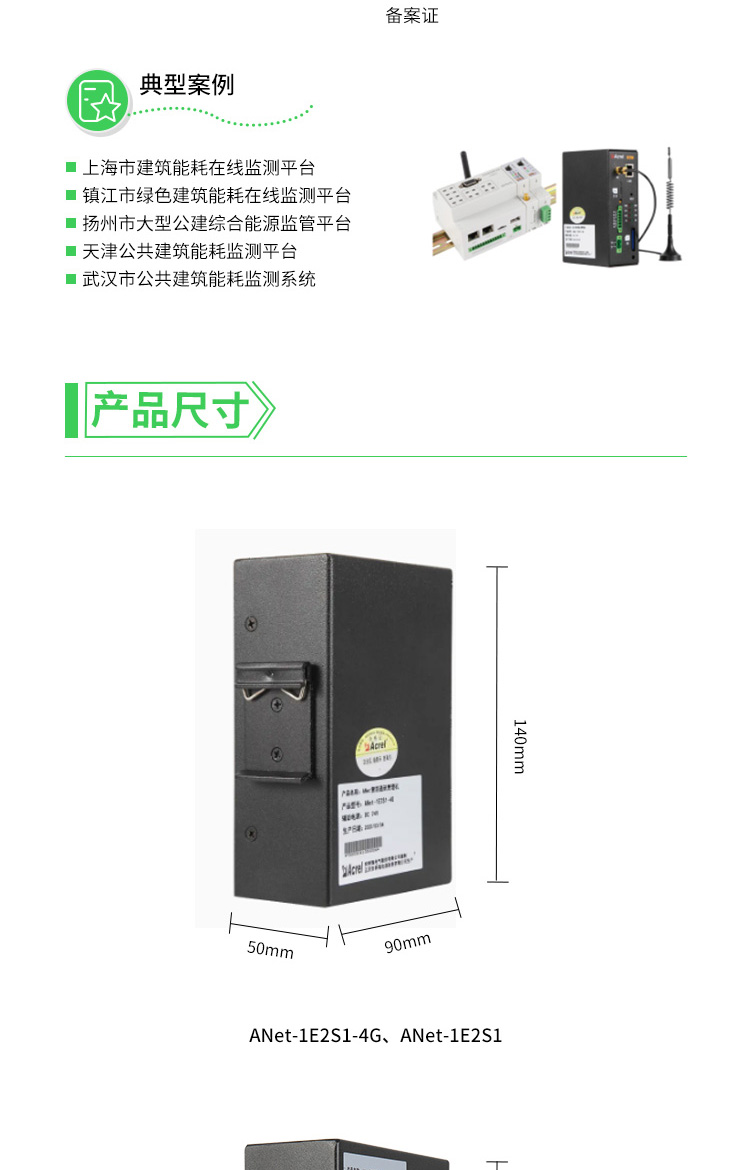
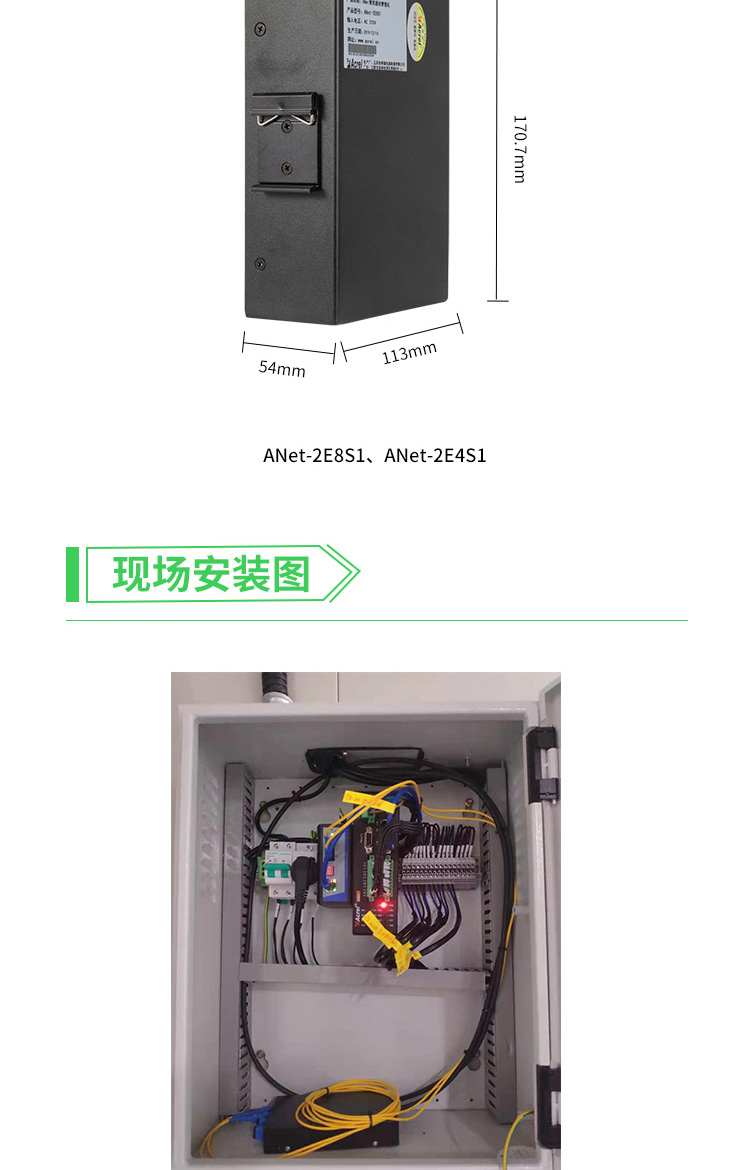
Intelligent DTU data collector
Category:
Electrical Engineering/Complete electrical and electrical equipment/Other electrical and electrical equipment
Model:
Acrelcloud-1000
Brand:
Acrel
model:
Acrelcloud-1000
type:
manufacturer
Processing & Customization:
No
purpose:
Safe Electricity Use
weight:
one
Place of Origin:
Jiangyin, Jiangsu
manufacturer:
Acrel
Retail Price
3,000.00USD
重量
kg
- Product Description
-
model Acrelcloud-1000
type manufacturer
Processing & Customization No
purpose Safe Electricity Use
weight one
Place of Origin Jiangyin, Jiangsu
manufacturer Acrel
Description :
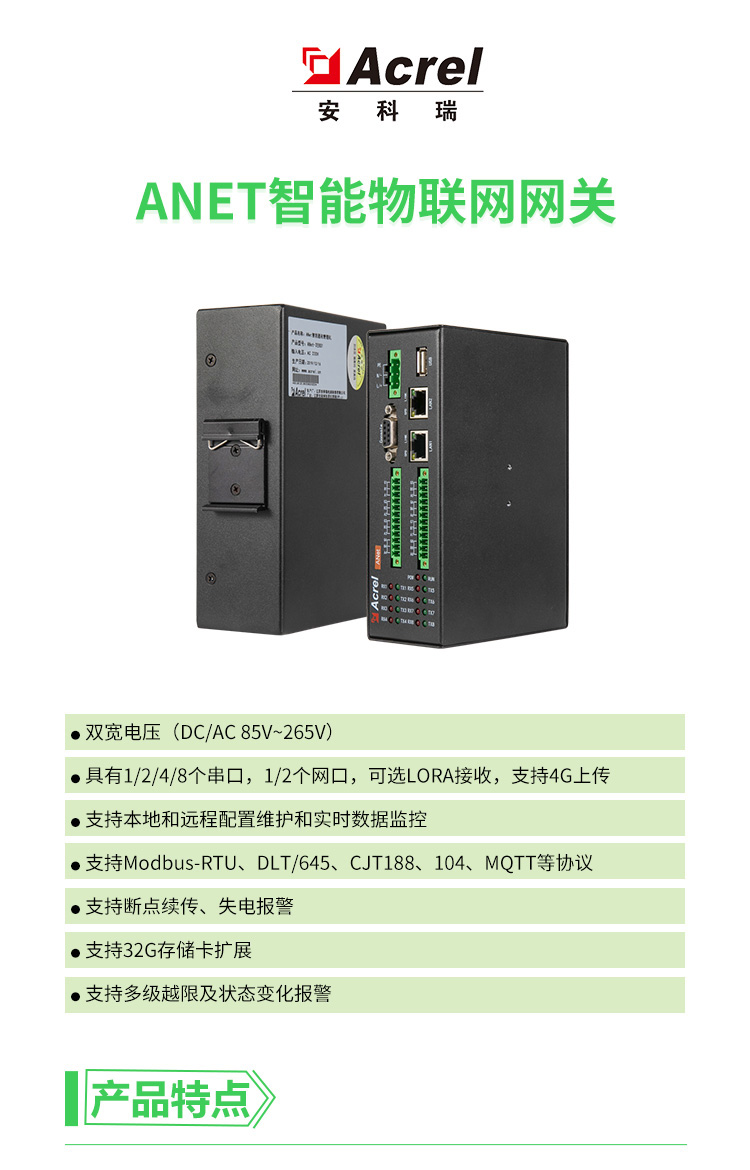
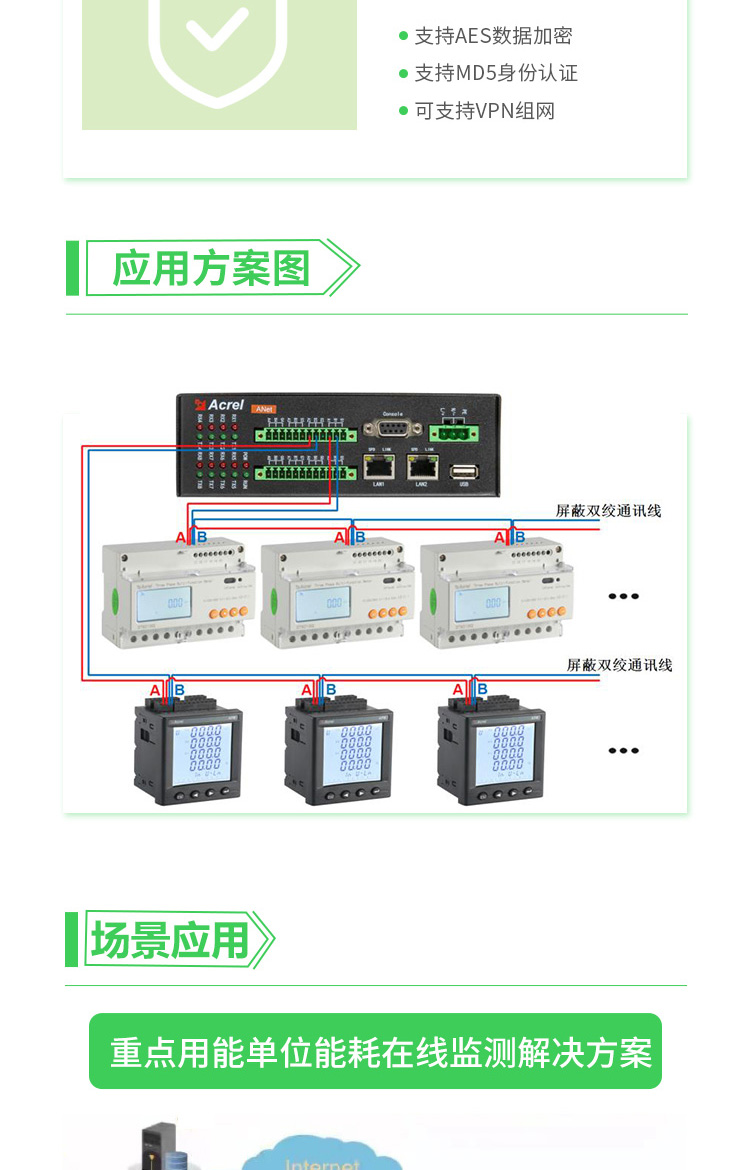
The main functions of the intelligent DTU data collector are:
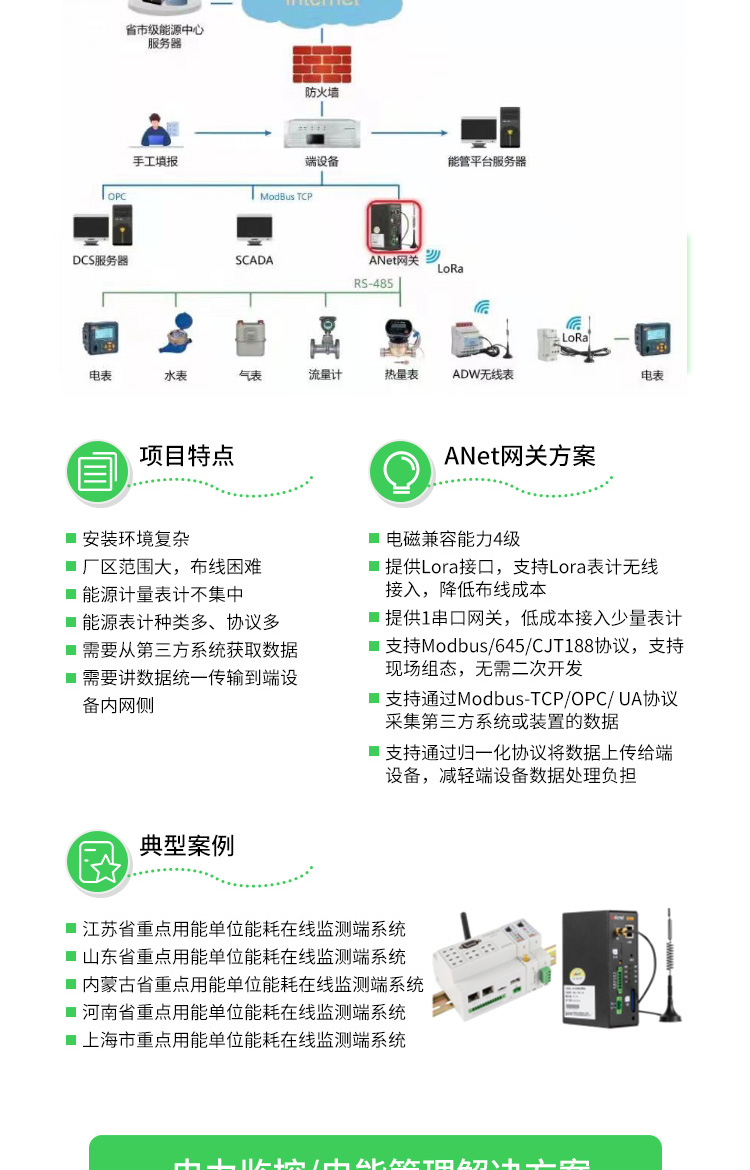
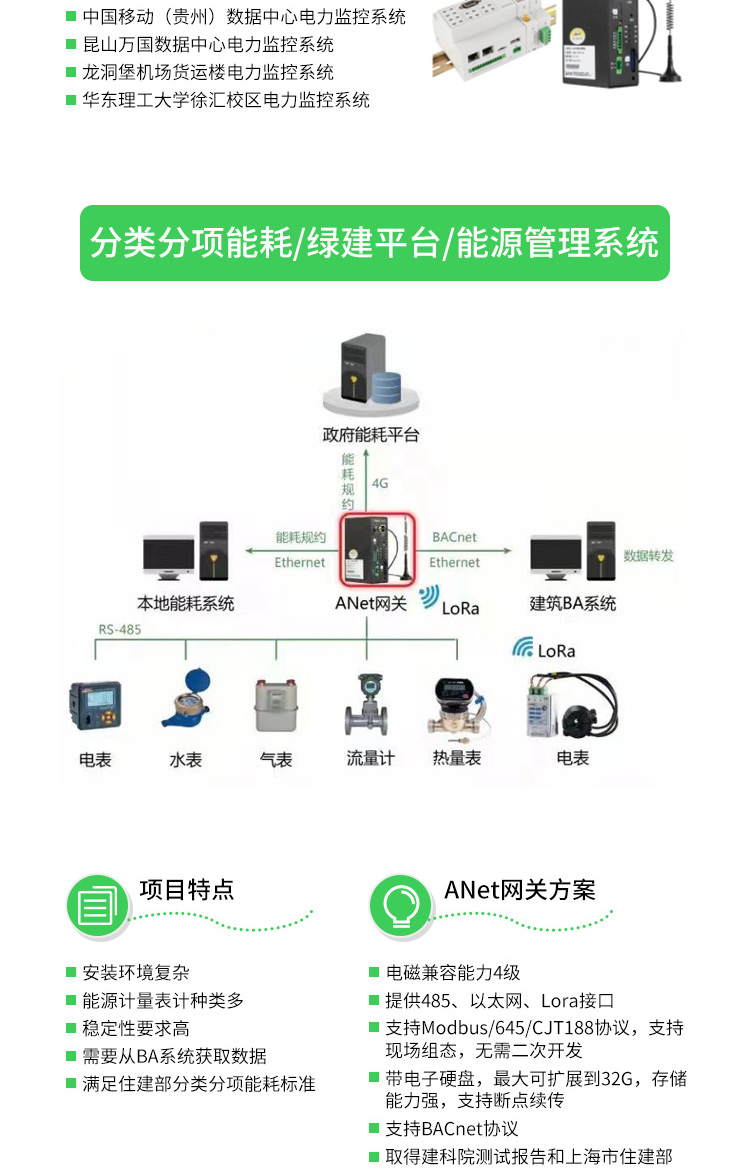
Acrel-5000web Building Energy Consumption Analysis System is a user side energy management analysis system that adds centralized collection and analysis of water, gas, coal, oil, heat (cold) and other energy sources on the basis of the electric energy management system. By subdividing and summarizing all energy consumption on the user side, it displays the usage and consumption of various energy sources to management personnel or decision-makers through intuitive data and charts, making it easy to identify high energy consumption points or unreasonable energy consumption habits, save energy, and provide accurate data support for users to further energy-saving renovation or equipment upgrades. Users can implement energy calculations in accordance with relevant national regulations, analyze the current situation, identify problems, tap into energy-saving potential, propose practical and feasible energy-saving measures, and submit energy calculation reports to the energy-saving management departments at or above the county level.
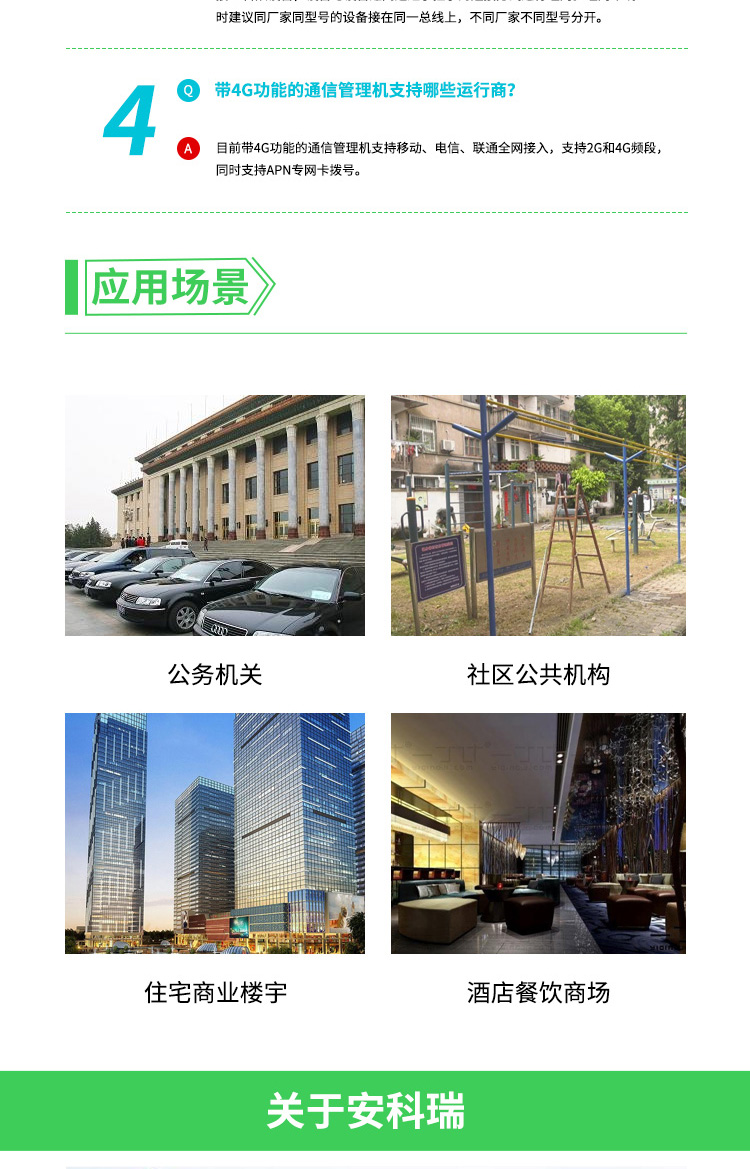
Application scenarios
The system design, construction, and operation maintenance of energy monitoring and management applicable to different industries such as public buildings, group companies, industrial parks, large properties, schools, hospitals, and enterprises.
System functions
System Overview
Platform operation status, monthly energy consumption conversion, map navigation, hourly and monthly curves of each energy consumption, and year-on-year analysis of energy consumption for the current day and month are displayed on a rolling basis.
Energy consumption overview
Compare the energy consumption of buildings, departments, regions, branches, and classified items, supporting hourly trends for the day, daily trend curves for the month, comparison of energy consumption statistics for different time periods, and comparison of total energy consumption on a month on month basis.
Since 2013, Shanghai has released energy consumption analysis reports for seven consecutive years. With the continuous development of related technologies and the continuous improvement of management requirements, the content and functions of the reports have also been continuously expanded and enriched. Changes in the content of energy consumption analysis reports over the years
From 2013 to 2015, the energy consumption analysis report mainly includes three parts: an introduction to the energy consumption monitoring platforms at the city and district levels, the energy consumption of buildings included in building energy monitoring, and a benchmarking analysis of typical building types. The energy consumption monitoring platform is still in its early stages, and many works are still in the exploratory stage. Relevant data resources still need time to accumulate, so the content is relatively limited and the reporting function is relatively single. In 2016, with the expansion of the number of real-time monitoring buildings, the improvement of data quality, and the increase of analysis content, there were significant changes in the energy consumption analysis report, mainly manifested in the significant adjustment of the report architecture and the expansion of content. In terms of architecture, the report has been adjusted to three major sections: city wide section, regional section, and industry section. The narrative logic of the report has been optimized from surface to film and then to point, improving the readability of the report. In terms of content, a large amount of energy consumption data and comparative analysis have been added, enriching the report content. This also reflects that after several years of accumulation, the energy consumption monitoring platform has begun to utilize the accumulated large amount of data resources, explore application functions, and leverage platform effects. During the period of 2017 to 2019, the energy consumption analysis report basically continued the structure of the 2016 version report and added management content on its basis. It mainly reflects that the management department of the energy consumption monitoring platform, on the basis of actively maintaining the quality of data upload, uses the accumulated data resources to carry out relevant research and analysis, develop Internet product applications, and carry out data services for building and industry management departments to further expand the role of the platform.

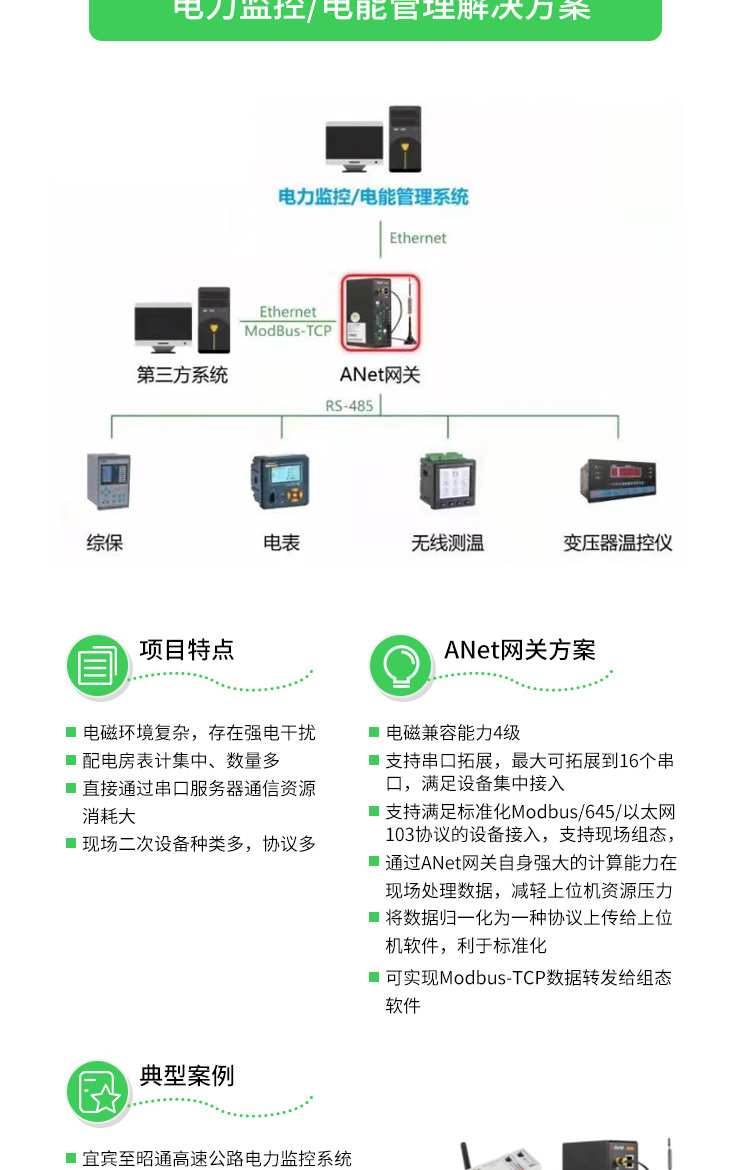
The local data collection substation comprehensive automation system requires a total of 34 devices for data collection. Local devices are mainly divided into three types of data: telemetry, remote signaling, and electrical energy based on data types. Overall system functional requirements: 1) Data acquisition and processing: Real time collection of various electrical parameters, switch values, temperature values, and energy meter readings on site through interval level equipment; 2) Screen display: information on the closing and opening status of each circuit, displacement information, protection equipment action and reset information, information on the DC system and the transformer system used, real-time data of each measurement value, various alarms, and other information. 3) Recording function: It has the storage function of various historical data such as voltage, current, power, electrical energy, accidents, alarm events, etc., for query, analysis, and printing. 4) Alarm processing: Users can classify and filter relevant alarms according to their needs, and categorize alarms into different alarm windows. 5) Should have comprehensive user permission management functions to avoid unauthorized operations; 6) Curve analysis function: It can display analog and electrical measurement data in real-time and historical databases in curve form, in order to analyze their current operating status and related historical trends; 7) Report statistics function: Through reports, it is easy to analyze the operating parameters of the power supply system and various circuits, and generate daily, monthly, energy statistics daily, monthly, and annual reports. 3.2.2 Power Protection Requirements In order to strengthen the protection of the power monitoring system of the distribution project in the logistics park, resist malicious damage and attacks on the monitoring system caused by malicious code, as well as other illegal operations, prevent the power monitoring system from collapsing and losing control, and prevent a substation system accident and other accidents caused by it, a power protection plan needs to be developed. The distribution project of the logistics park is equipped with a substation monitoring system, a dispatch data network system, and an electrical collection device. The substation monitoring system of this station adopts the system configuration software Acrel-1000 substation comprehensive automation monitoring system, and is equipped with a monitoring backend host and operator station. The main function of the substation is to achieve data collection, monitoring, and control, with the monitoring and control computer as the main body, combined with detection devices, execution mechanisms, and the monitored and controlled objects (production processes) to form a whole. In this system, the computer directly participates in the detection, supervision, and control of the monitored object, using the IEC104 protocol and port number 2404, and performs real-time data transmission with the ground automation main station system. The operating system of the device adopts 64 bit WINDOWS 7 flagship version, and the database version is SQL Server 2008R2. This station is equipped with an ERTU3000C power collection terminal produced by Huayun Information. The electricity collection terminal is a device used for collecting, storing, and transmitting metering and billing information collected and generated by power station gateway meters. It is equipped with two Ethernet ports and powered by AC/DC 220V. The device communicates with the electricity meter to collect the metering and billing information collected and generated by the meter. The collector communicates with the metering and billing main system through scheduling data network non real time services, and the communication port for accessing the network is 1020, reporting the collected and generated metering and billing information.
Intelligent DTU data collector
AfterSalesService :
Key words:- Intelligent DTU Ankerui Gateway Production Plant


