


Choose Ankerui manufacturer for efficient energy consumption management
Category:
Electrical Engineering/Complete electrical and electrical equipment/Other electrical and electrical equipment
Model:
ACREL
Brand:
Acrel
brand:
Acrel
model:
APF
type:
manufacturer
Processing & Customization:
No
purpose:
Distributed photovoltaic collection
Motor power:
100KW
Overall dimensions:
35mm guide rail
weight:
two
Place of Origin:
Jiangyin, Jiangsu
manufacturer:
Ankerui manufacturer
Retail Price
100,000.00USD
重量
kg
- Product Description
-
brand Acrel
model APF
type manufacturer
Processing & Customization No
purpose Distributed photovoltaic collection
Motor power 100KW
Overall dimensions 35mm guide rail
weight two
Place of Origin Jiangyin, Jiangsu
manufacturer Ankerui manufacturer
Description :
Introduction:
Ankerui Enterprise Energy Management Platform adopts automation, information technology, and centralized management mode to implement centralized and flat dynamic monitoring and data-driven management of the production, transmission, distribution, and consumption links of enterprises. It monitors the consumption of various energy sources such as electricity, water, gas, steam, and compressed air in enterprises. Through data analysis, mining, and trend analysis, it helps enterprises to conduct energy consumption statistics, month on month analysis, energy cost analysis, energy consumption prediction, and carbon emission analysis for various energy demands and consumption situations, energy quality, product energy consumption per unit, energy consumption of each process, and energy utilization of major energy consuming equipment. It provides basic data and support for enterprises to strengthen energy management, improve energy utilization efficiency, explore energy-saving potential, and energy conservation.
Application location:
Steel, petrochemicals, metallurgy, non-ferrous metals, mining, pharmaceuticals, cement, coal, logistics, railway, aviation industry, wood, chemical raw materials, as well as manufacturing of mechanical and electrical equipment, electrical products, and tools.
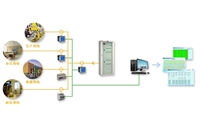
system architecture

System functions
home page
The homepage displays the total energy consumption, conversion value, energy cost, energy consumption trend, sub item energy consumption proportion, regional energy consumption comparison of various types of enterprises, and three-dimensional displays the energy consumption dynamics of important processes or equipment of the enterprise, which can intuitively understand the current energy consumption of the enterprise.

operation monitoring
The dynamic display of the energy management system provides real-time monitoring of various energy sources (electricity, water, steam) used by enterprises, and offers dynamic graphic displays from overview to specific details. It also provides regional data monitoring, allowing for quick browsing of managed energy consumption data on factory floor plans or workshop floor plans.

operation monitoring
The system provides real-time monitoring of the operating status of the energy management system, enabling real-time monitoring of the changing trends of key energy consumption parameters, the operating status of energy consuming equipment, and system operation alarm events during the operation of the energy system, ensuring the safety, reliability, and stability of the entire energy supply, conversion, and consumption process. The system provides graphical tools that can not only configure digital monitoring interfaces, but also have real-time trend display.

operation monitoring
Display the electrical main wiring diagram of the power distribution system to achieve real-time monitoring of all electrical parameters and switch circuit breaker status, such as voltage, current, frequency, power, power factor, three-phase imbalance, harmonics, and other parameters.
● Schematic diagrams of the distribution of branch pipelines in water, gas, compressed air and other systems, as well as real-time monitoring of parameters such as flow rate, pressure, temperature, etc;
Real time monitoring of the operating status and energy consumption parameters of key energy consuming equipment systems (such as compressors);
Real time event alarm monitoring for protection signals such as overvoltage, overcurrent, undervoltage, system communication interruption, power and non power parameter exceeding limits, and energy consumption exceeding warning.
The display of the process flow chart focuses on the operating parameters and energy consumption of each equipment in the process
Transformer monitoring
Display the load situation of each transformer, so as to scientifically and reasonably plan the configuration of transformers. By comparing the electrical efficiency under various operating parameter states, calculate transformer losses and identify the economic operating range of transformers. According to the economic operating range of transformers, adjust the load to reduce transformer losses and save electricity.

Energy consumption statistics
The system supports quick query and display of daily, weekly, monthly, quarterly, and annual energy consumption, year-on-year and month on month comparisons, product unit consumption, product benchmark comparisons, energy consumption rankings, etc. for different measurement and monitoring objects of enterprises. The data is used in the form of bar charts, pie charts, histograms, etc. to achieve statistical analysis of energy consumption data such as electricity consumption, water consumption, and gas consumption in the system. From the entire enterprise to individual equipment or workshops, statistical analysis of energy consumption data for the entire enterprise can be achieved by querying and analyzing energy consumption data from metering nodes in these areas, meeting users' requirements for querying energy consumption data for areas, workshops, processes, and equipment types at any time period. By comparing the energy consumption data of different regions, understanding the energy consumption patterns of different object regions, automatically ranking the energy consumption of these objects, identifying loopholes and unreasonable areas in energy use, and adjusting energy allocation strategies to reduce waste in energy use.
Sub item energy consumption
The system provides itemized statistics on the energy consumption of enterprises. According to the sub items, use bar charts and pie charts to display the energy consumption of each sub item in a clear and intuitive manner. By analyzing energy consumption trends, timely grasp the sub item energy consumption trends of enterprises. For abnormal energy consumption in sub items, it can be detected in real time, adjust strategies, improve energy consumption, and save energy.

Product/output unit consumption
The system can be integrated with the enterprise MES system to import product output. Provide manual input function for data that cannot be imported. By collecting energy consumption data through the system and combining it with product output, calculate product unit consumption, generate a trend chart of product unit consumption, and conduct year-on-year and month on month analysis. So that enterprises can adjust their production processes based on the unit consumption of products, thereby reducing energy consumption.
Energy cost analysis
The system supports the statistical comparison function of the total cost of various energy consumption for the enterprise as a whole and various objects such as workshops that require separate energy consumption assessment. It can provide the consumption and corresponding cost data of various energy types such as electricity, water, and gas in the statistical period, and can also perform percentage statistics and comparisons of the cost of various energy sources to understand the detailed distribution of energy cost in the entire enterprise. Simultaneously supporting the analysis of unit cost expenses. Users can choose multiple assessment areas for comparative analysis of energy consumption costs, providing real and reliable data basis for establishing effective performance reward and punishment mechanisms and daily management for users.

Energy cost prediction analysis
The system supports providing energy cost budget management functions for enterprises and areas that require separate assessment and measurement, allowing users to enter detailed budget plans for energy costs. By comparing actual energy expenses with budget expenses, budget execution management can be carried out, and users can intuitively understand whether monthly or annual energy costs exceed the budget, facilitating timely budget adjustments and interventions. In addition, the system also supports cost prediction of energy costs according to the prediction algorithm, and predicts the energy cost expenses for the following months based on historical budget execution and actual energy consumption data, helping users to effectively manage cost plans.

Performance analysis
Daily, weekly, monthly, annual, and time period performance statistics are conducted on various energy usage, consumption, and conversion by team, region, workshop, production line, section, equipment, etc. KPI comparative assessment is conducted based on performance indicators formulated according to energy plans or quotas to help enterprises understand internal energy efficiency levels and energy-saving potential.

energy consumption prediction
By analyzing the energy consumption usage of enterprise workshops, production processes, production equipment, etc., an energy consumption calculation model is established. The data and model are modified based on artificial intelligence algorithms to predict and analyze future energy consumption trends of the enterprise, providing effective decision-making basis for energy conservation.
operation monitoring
The equipment operation monitoring function of the system is specifically designed to provide comprehensive management for key energy consuming equipment, including monitoring of equipment operation status and key parameters, equipment ledger management, equipment energy consumption statistical analysis, and equipment maintenance management. Real time collection and monitoring of equipment operating status parameters and working condition parameters can timely determine whether the operating conditions of the equipment are normal; Equipment energy consumption statistical analysis can provide real-time energy consumption and historical energy consumption trend analysis and comparison for equipment objects; Equipment ledger management and maintenance management can establish a comprehensive equipment basic information file, which can quickly query and classify various characteristic parameters of the equipment, manage the maintenance and replacement history of the equipment and its main components with information technology, and provide functions such as equipment scheduled maintenance expiration reminder and overdue maintenance alarm, facilitating the establishment of economic operation files for each important equipment, ensuring the safe, stable, and economical operation of the equipment.

Energy balance and loss analysis
Energy balance and loss statistical analysis mainly provides energy balance analysis for various links in the conversion, transportation, and use of energy such as electricity, water, and gas in enterprises, timely discovering problems such as energy leakage and abnormal energy consumption during use, and reminding users to intervene in a timely manner. By separately counting the energy supply and consumption of important energy consuming links and calculating the difference in energy loss between the two, the degree of energy loss in each link can be determined. For example, conducting a loss analysis on the sum of the metering consumption of the main pipes in the water system and the metering consumption of various workshop branch pipes is beneficial for timely detection of water pipe leaks or illegal water usage; Perform loss analysis on the low voltage incoming line measurement of the power system and the sum of the measurement consumption of each feeder circuit to determine whether there are abnormal power consumption sites such as illegal power consumption and theft, helping users discover and correct energy waste problems during energy use, and reducing the overall operating cost of energy.
Energy-saving analysis
Energy saving analysis is mainly used to analyze the specific energy-saving effects of enterprises after implementing energy-saving measures. By inputting energy-saving measures, comparing and analyzing the energy consumption before and after the implementation of energy-saving measures, the effectiveness of energy-saving measures can be evaluated, providing assistance for enterprises to save energy and improve economic benefits.

analysis report
The user analysis report provided by the system is mainly for the middle and senior management of the enterprise to provide a summary of energy consumption data statistics and analysis conclusions, focusing on the overall energy consumption situation and trends. Generally, it includes the energy utilization situation, line loss situation, equipment operation situation, operation and maintenance situation, energy consumption trend ranking, key energy consumption ranking, comprehensive energy consumption ranking, etc. of the enterprise. By configuring a variety of graphical components into a user analysis report, users can comprehensively understand the operation of the system, facilitate the discovery of equipment abnormalities, identify improvement points, and explore energy-saving potential based on energy consumption.
Event log
Event alarm analysis mainly provides a basis and analytical means for diagnosing and analyzing abnormal operating states or fault causes of the system. The various alarm times generated during the system operation will be automatically recorded and stored. By searching and querying the occurrence time, scope object, event type, event level, and event description keywords, the target event can be quickly queried and classified.

Custom Report
Users can flexibly generate various reports by customizing report headers and columns, ranging from energy consumption data and cost comparisons to power peak and valley level reports; From carbon emission reports to system energy consumption, from energy consumption indicators to energy consumption budgets, and so on, users do not need tedious editing, only simple operations can generate exquisite reports.
 Key words:
- Choose Ankerui manufacturer for efficient energy consumption management


